Hello Friends,
How are you doing? I am back with my next article about “how to make a button to zoom-in and zoom-out a graph in Excel VBA”. this is the second method I am going to explain you. In my previous article, I had explained about the very basic method.
There were 4 limitations in the previous method which I explained it. In this article I am going to address all the limitations mentioned in the previous method.
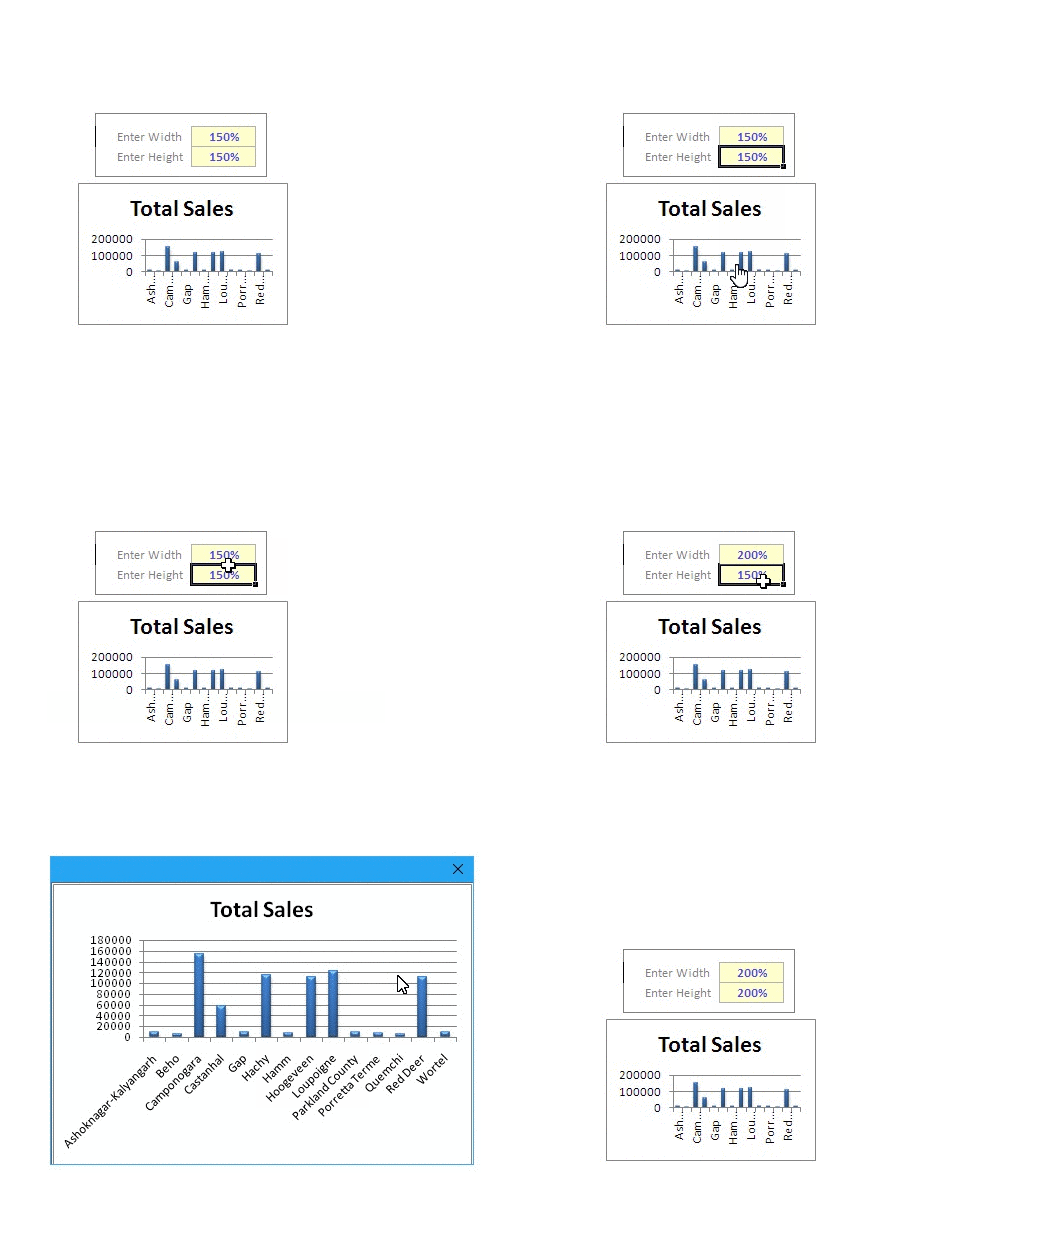
This method is going to be an illusion created for zoom-in and zoom-out 😉
Steps to create Zoom-in Zoom-out button for Graph
1. Taken input from the user about the width or Height
2. Resize the graph with that size (DO NOT SHOW THIS TO USER HAPPENING… by using below VBA statement)
Application.ScreenUpdate = False
3. Now save this large graph as an image in the temp folder.
4. Create a UserForm and add a placeholder for an image
5. Make the UserForm hegiht and width as “auto” – So that form size get adjusted according to the size of the image
6. While loading or showing the UserForm, embed the image which you have saved it in the temp folder.
7. Now on closing the userform having graph image, delete the image which you saved it in the temp folder and release the memory.
Important
In the above steps, the sequence of step 2 and 3 is very important. If you are resizing the image after saving it, then you will see only a big picture of the same size graph. But here the purpose is to zoom-in the graph and see every small details in it which might have got hidden because of this size of the graph.
Explanation of VBA Code used to build this
Read carefully all the comments which I have provided in the below codes. They are easy to understand like what each and every statement of VBA code is doing? What is the use of them. If you still have any doubt or question or suggestion.. feel free to let me know by commenting your question in the comment section below:
Public tempFileName
Sub Zoom_Chart()

Dim i As Integer
Dim strChartName As String
Dim dZoomInWidth As Double
Dim dZoomInHeight As Double
Dim dOutWidth As Double
Dim dOutHeight As Double
Dim rngZoom As Range
Dim rngChart As Range

        dZoomInWidth = ActiveSheet.[rngZoomWidth].Value '<-THIS CAN BE CHANGED
        dZoomInHeight = ActiveSheet.[rngZoomHeight].Value '<-THIS CAN BE CHANGED
        dOutWidth = 1 / dZoomInWidth 'zooms back to original size
        dOutHeight = 1 / dZoomInHeight
    '-----------------------------------------------------------------------------------
    'Set the button/shape name based on the shape that was clicked by the user
    strChartName = Application.Caller
    tempFileName = VBA.Environ$("Temp") & "\zoomGraph.gif"
    'Set range of zoom button for intersection check
    Set rngZoom = Range(ActiveSheet.Shapes(strChartName).TopLeftCell.Address)
    With ActiveSheet
            Set rngChart = Range(.Shapes(strChartName).TopLeftCell.Address)
                If ActiveSheet.Shapes(strChartName).Type = msoChart Then
                With ActiveSheet.Shapes(strChartName)
                        Application.ScreenUpdating = False
                        .ZOrder msoBringToFront
                        dashboard.Unprotect password:="Vishwa@123"
                        .ScaleWidth dZoomInWidth, msoFalse, msoScaleFromTopLeft
                        .ScaleHeight dZoomInHeight, msoFalse, msoScaleFromTopLeft
                        .Chart.Export Filename:=tempFileName, FilterName:="GIF"
                        .ScaleWidth dOutWidth, msoFalse, msoScaleFromTopLeft
                        .ScaleHeight dOutHeight, msoFalse, msoScaleFromTopLeft
                        dashboard.Protect password:="Vishwa@123"
                        zoomForm.Show
                        ActiveSheet.Shapes(strChartName).ZOrder msoBringToFront
                        'Kill the temp file now
                        Kill tempFileName
                End With
                End If
    End With
End Sub
How does it look after creating this
On clicking on graph this is how you see graph based on the % provided about height and width for the Zoom.
Download FREE Copy to Play around
I have created one sample Excel file with such Zoom-in and Zoom-out feature. You can download it and play around.. Happy excel macro learning 🙂


Hey Vishwa,
Thanks for posting this, and for all the other great resources you’ve posted.
I’m wondering if you have a method for adjusting the range of a chart to match new data. So, if I have a histogram produced by QI Macros saved in a template where I’ll enter different data for different projects, I’d like to have that histogram’s X and Y ranges adjust to fit the new data. I haven’t been able to do this and have all of the references within the chart window update as well (lines representing mean, LSL, USL, etc.). The only reliable method I’ve come up with is to rerun the macros that create the charts every time the data changes. That’s fine for me, but I’d like to have a template to be used by people who don’t necessarily know how to run those macros.